Trend & HTF Analysis with ADX, DI+ / DI−, Slope & Regime
What makes this indicator stand out
- ADX, DI+ and DI− combined in one indicator
- optional ADX slope visualization
- optional regime background for bullish, bearish, or no-trend conditions
- optional higher timeframe trend analysis with automatic or custom HTF selection
- table section showing ADX value, slope, directional bias, and DI+ / DI− directional change
- optional higher timeframe table data for broader trend context
- clean and minimal chart integration
- flexible visual customization (screenshots use the JustIndicate default theme)
- comprehensive alert system
The indicator combines ADX trend strength, directional bias, slope, and regime context in a clean tool for focused trend analysis.
Overview
The indicator uses ADX together with DI+ / DI− to evaluate:
- trend strength
- directional bias
- current market regime
Optional higher timeframe data can be added automatically or with a custom timeframe for broader trend context.
ADX and Directional Movement
ADX (Average Directional Index) measures trend strength, while DI+ and DI− indicate the current directional bias.
The core of the indicator is based on:
- ADX
- DI+ (bullish direction)
- DI− (bearish direction)
ADX shows how strong a trend is, while DI+ and DI− show which side is currently dominant.
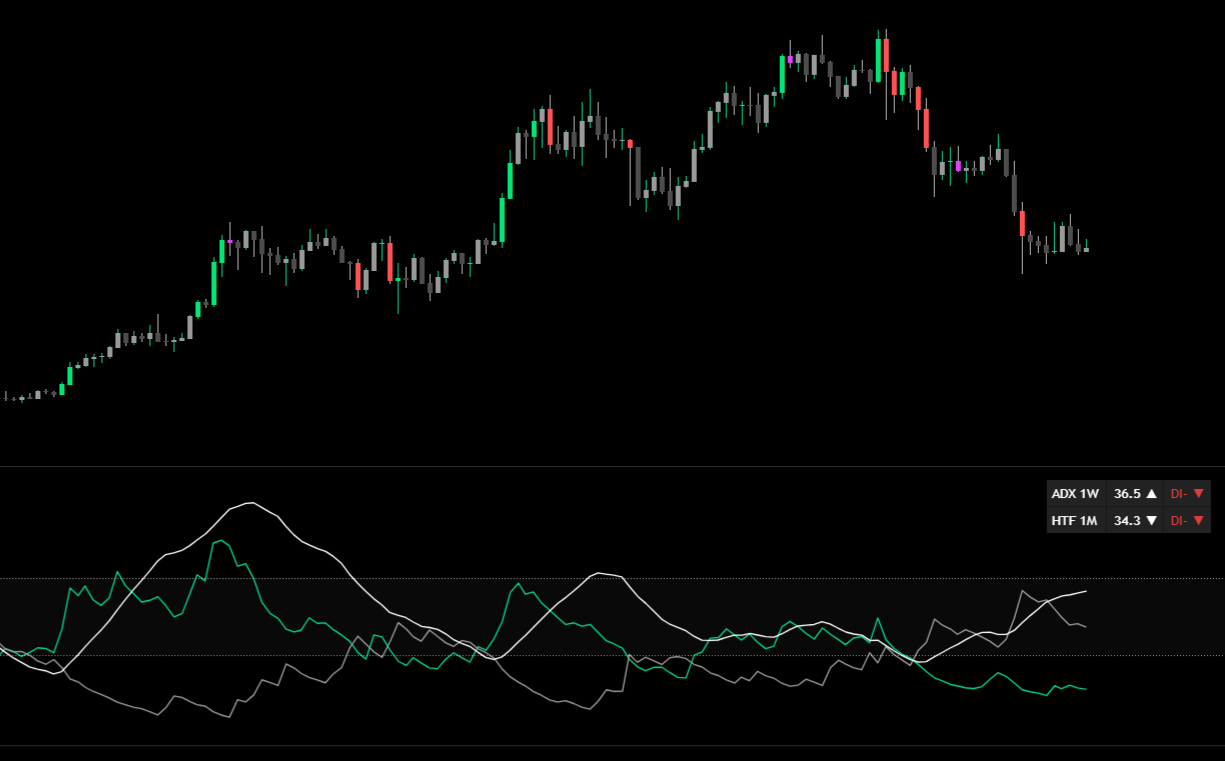
In the screenshots, ADX is displayed in white, DI+ in green, and DI− in gray.
The DI line positioned above the other defines the current directional bias:
DI+ above DI− indicates bullish bias, while DI− above DI+ indicates bearish bias.
This dominant direction is also reflected in the table.
This allows traders to evaluate both whether trend strength is present and which side currently has directional control.
The indicator includes a selectable mode that defines how ADX and DI interact:
- Linked (ADX + DI)
Directional signals are filtered by ADX, meaning trend direction is only considered when sufficient trend strength is present. - Independent
ADX and DI operate separately, allowing directional signals regardless of trend strength.
Slope Analysis
The indicator includes optional ADX slope visualization.
Available options include:
- rising or falling ADX slope
- visual slope indication in the table
This helps traders quickly see whether trend strength is increasing or weakening.
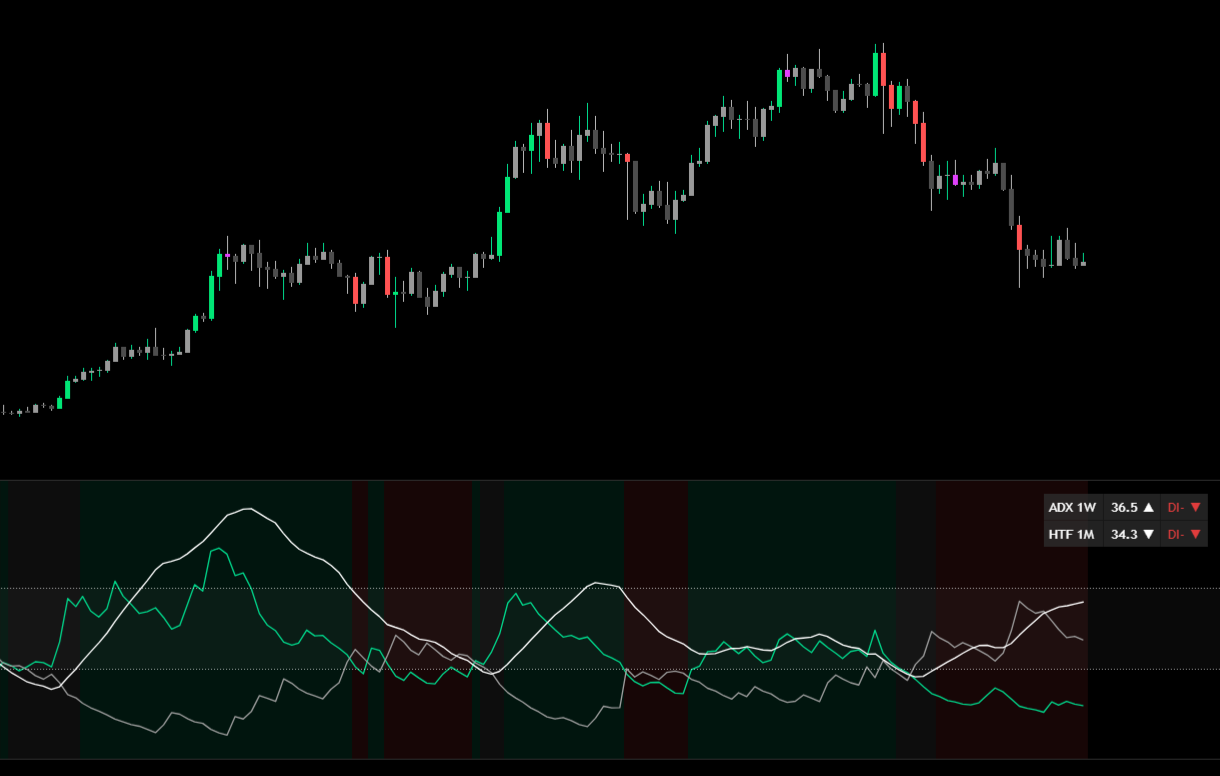
Regime Detection
The indicator can classify the current market regime based on the selected mode.
- In Linked mode, bullish or bearish conditions are only shown when ADX confirms a trend, otherwise neutral
- In Independent mode, direction is always shown based on DI+ / DI−, without a neutral state
An optional background color can be enabled to visualize the current regime directly in the pane.
Higher Timeframe Context
Optional higher timeframe analysis can be enabled for broader trend context.
Available options include:
- automatic HTF selection
- custom HTF selection
This adds higher timeframe ADX and directional bias to the analysis without needing a separate indicator.
Table Section
The optional table section provides quick chart context.
Available table information includes:
- current ADX value
- current slope direction
- current directional bias (linked or independent based on selected mode)
- DI+ / DI− directional change (rising or falling)
- optional higher timeframe ADX, slope, DI+ / DI− bias, and directional change
The table position, background color, and text size can be customized.
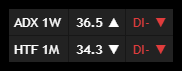
ADX 1W value: 36.5, rising slope
DI- dominant (above DI+), falling
HTF 1M value: 34.3, falling slope
DI- dominant (above DI+), falling
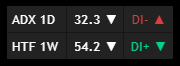
ADX 1D value: 32.3, falling slope
DI- dominant (above DI+), rising
HTF 1W value: 54.2, falling slope
DI+ dominant (above DI-), falling
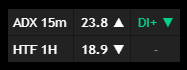
ADX 15m value: 23.8, rising slope
DI+ dominant (above DI-), falling
HTF 1H value: 18.9, falling slope
DI neutral – ADX under Threshold of 20
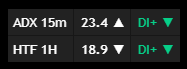
ADX 15m value: 23.4, rising slope
DI+ dominant (above DI-), falling
HTF 1H value: 18.9, falling slope
DI+ dominant (above DI-), falling
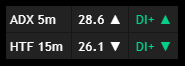
ADX 5m value: 28.6, rising slope
DI+ dominant (above DI-), rising
HTF 15m value: 26.1, falling slope
DI+ dominant (above DI-), falling
Visual Control
The indicator is built for clean and flexible chart visualization:
- optional ADX slope coloring
- optional regime background
- optional second ADX level
- optional table section
- customizable colors and visual settings (screenshots use the JustIndicate default theme)
This allows the indicator to fit into different chart styles without adding unnecessary clutter.
Alerts
Alerts are available for key trend events:
- DI+ / DI− bullish and bearish crosses
- DI+ and DI− turning up or down
- ADX crosses above or below the trend threshold
- ADX crosses above or below the second level
- HTF DI+ / DI− crosses
- HTF DI+ and DI− turning up or down
- HTF ADX threshold crosses
- HTF ADX second-level crosses
All alert conditions can be used independently from the currently selected display settings.
On TradingView
This indicator (free) – Anchor Your Analysis
JustIndicate profile
More indicators on this website
MACD Smart Suite
RSI Smart Suite + STC
Volume Smart Suite
Moving Averages Smart Suite